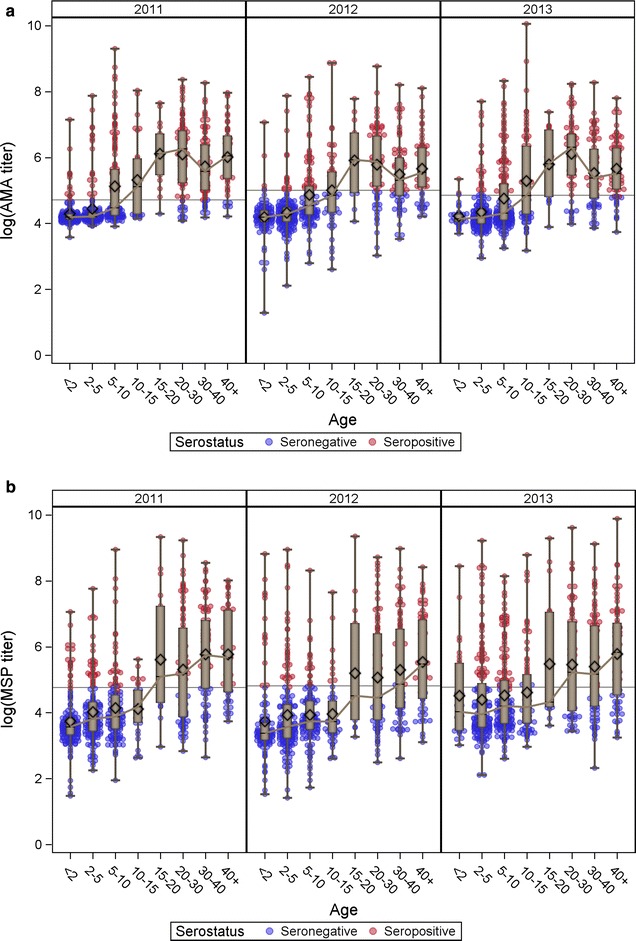
Fig. 2.

Age-stratified seroprevalence curves in each survey years. For AMA-1 (a) and MSP-1 (b). The points denote an individual’s log-titre value for the respective antibody in the given survey year, colored red for titres classified as seropositive and blue for titres classified as seronegative. The solid lines connect the median log-titre within each age group
