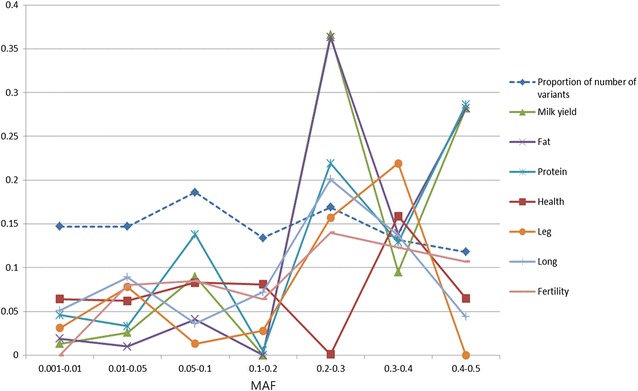
Fig. 1.

Proportion of variants in different MAF classes and their relative contribution to DRP variance for different traits. On the x axis are the variants with MAF classes: 0.001–0.01; 0.01–0.05; 0.05–0.1; 0.1–0.2; 0.2–0.3; 0.3–0.4 and 0.4–0.5 and on the y axis is the proportion of number of variants over the total number of imputed sequence variants (dark blue), relative contribution of explained DRP variance for different MAF classes variants for different traits based on “Trait abbreviation” in different colors
