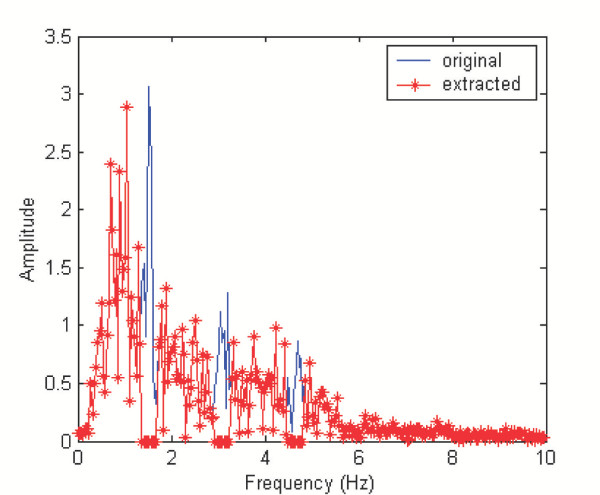
Figure 1.
Typical spectra of contaminated signal and extracted artifact. Spectrum of the contaminated signal (solid) is obtained by FFT. Coefficients of the spectrum within 0.5 Hz of the primary cardiac frequency or its harmonics were set to zeros to result in the spectrum of pure artifact noise (starred).

