Figure 1.

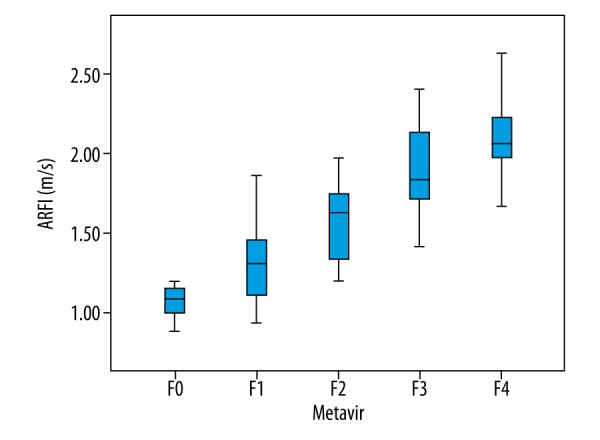
Box plots showing distribution of ARFI values according to histological fibrosis stage. The length of the box is the interquartile range and the median (50th percentile) is the line drawn through the box.

Box plots showing distribution of ARFI values according to histological fibrosis stage. The length of the box is the interquartile range and the median (50th percentile) is the line drawn through the box.