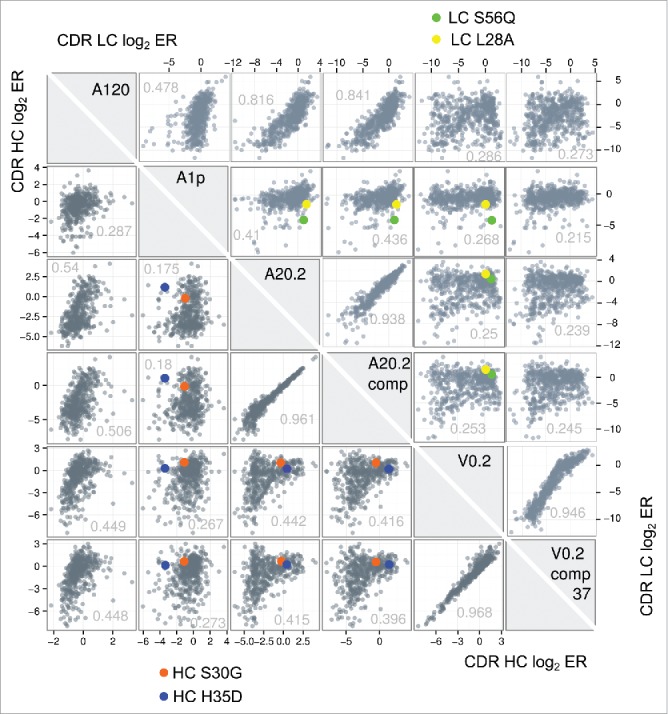
Figure 2.

A cross-correlation plot of the enrichment ratios (ER) of each single mutation from 6 NNK phage library pannings is shown to visualize the distribution of ERs obtained from the different panning conditions and how they relate to each other. Each box shows a correlation between two ER data sets obtained from different phage panning tracks as scatter plot of all HC CDR single mutations (lower left triangle) or LC CDR single mutations (upper right triangle). The respective X- and Y-axes represent the respective log2ER for the sample labels in the diagonal gray boxes. To visualize the behavior of selected mutations that passed our selection filter (see main text for details) for candidates that reduce Ang1 binding while maintaining Ang2/VEGF binding the enrichment ratios of those mutants are highlighted as circles in blue and orange. The Pearson correlation coefficient for each panning pair is listed in the scatter plots.
