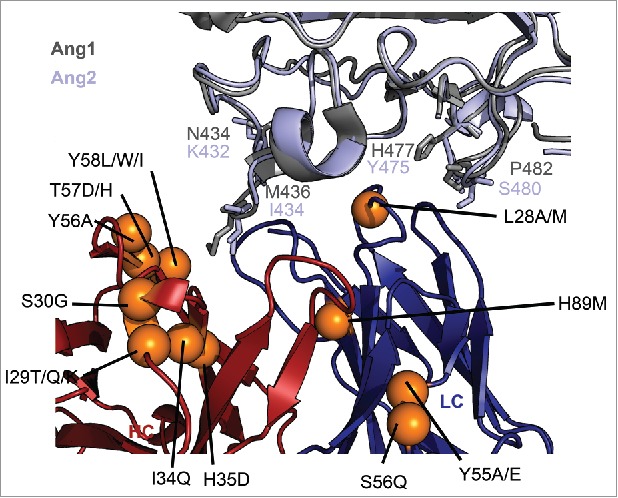
Figure 4.

Structural mapping of the specificity determining mutations. The crystal structure of the 5A12:Ang2 complex (PDB 4ZFG) is shown in cartoon representation. The heavy chain is shown in blue, the light chain in red and Ang2 in light blue. The crystal structure of Ang1 (PDB 4JYO) has been structurally aligned onto Ang2 and colored in gray. The orange spheres represent location of mutations that greatly reduce Ang1 binding while maintaining VEGF and Ang2 binding affinity. The side chains of residues different in Ang1 and Ang2 that are located in the structural epitope of Ang2 are shown in stick representation.
