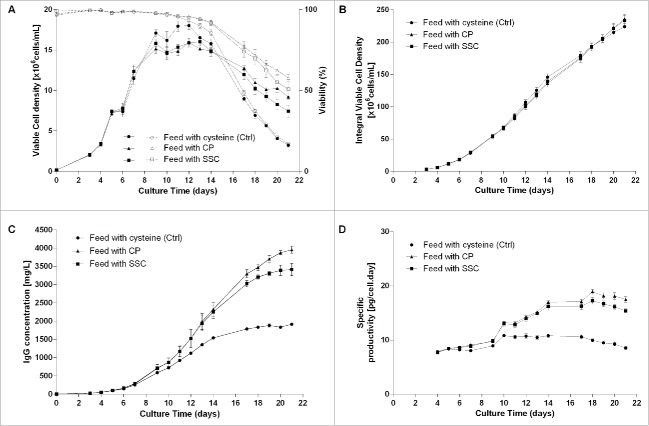
Figure 1.
1.2 L bioreactor fed-batch experiment using a feed containing either cysteine (control, n = 2), cysteine stabilized with pyruvate (CP) or SSC (n = 5 each). Feed was added at 3% (v/v) at day 3 and 6% (v/v) at days 5, 7, 9 and 14. (A) Viable cell density (plain lines) and viability (dotted lines), (B) Integral viable cell density, (C) IgG concentration in the supernatant measured by a turbidometric method, (D) Specific productivity.

