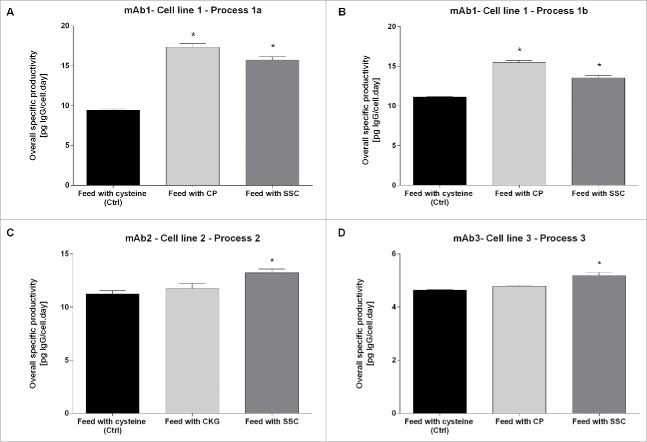
Figure 2.
Overall cell specific productivity for mAb1 to 3 in cysteine, CP/CKG and SSC-containing processes. The overall specific productivity was determined by calculating the slope from the linear regression between titer and corrected integral VCD. Values are mean ± SEM obtained from 4 independent replicates. A p-value of less than 0.05 (*) was considered significant (Mann-Whitney test).

