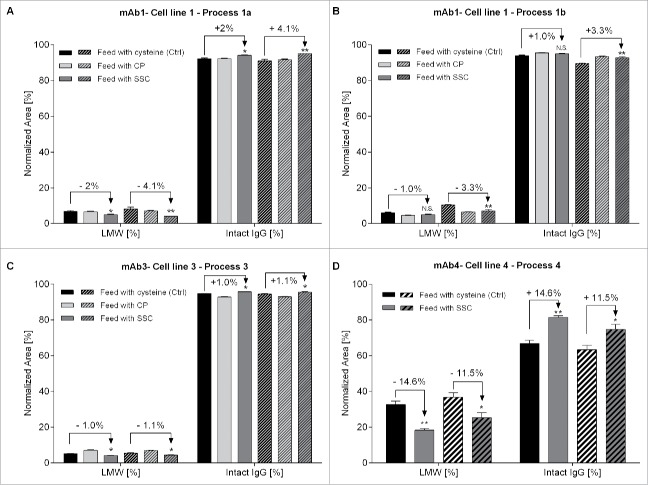
Figure 5.
Relative quantification of intact IgG and total low molecular weight forms using capillary gel electrophoresis. Fragments were separated according to their size under non-reduced conditions using CE-SDS. (A) Quantification of mAb1 at day 13 (n = 6, plain bars) and day 18 (n = 6, hatched bars) of the fed-batch process 1a. (B) Quantification of mAb1 at day 5 (n = 8, plain bars) and day 9 (n = 8, hatched bars) of the fed-batch process 1b. (C) Quantification of mAb3 at day 14 (n = 8, plain bars) and day 18 (n = 8, hatched bars). (D) Quantification of mAb3 at day 8 (n = 6, plain bars) and day 12 (n = 6, hatched bars). Statistical differences were assessed by Kruskal-Wallis and Dunn's multiple comparison tests. P-values of less than 0.05 (*) and 0.01 (**) were considered significant. P-values higher than 0.05 are marked as non-significant (N.S.).

