
Figure 2.
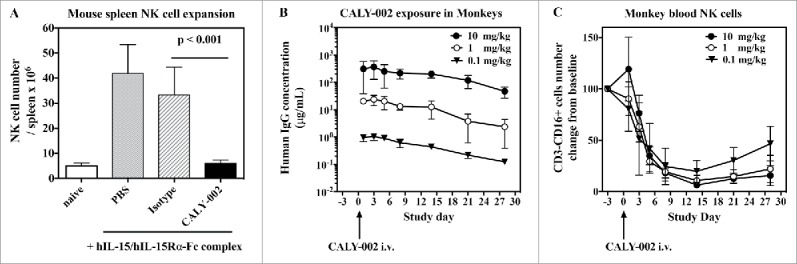
Pharmacodynamic inhibition of IL-15 by in vivo in mice and monkeys. (A) NK cell expansion was induced in groups of 5 mice by injections of hIL-15 mixed with hIL-15Rα-Fc at Day 1, 2 and 3. PBS (gray bar), CALY-002 (black bar) or control isotype antibody (dashed bar) were injected 20 minutes before the first injection of hIL-15/hIL-15Rα-Fc. Animals were killed at Day 4 and number of NK cells present in individual spleens were determined. Naive mice were injected with saline alone (no hIL-15/hIL-15Rα-Fc, white bar). Data are plotted as mean ± SD. Statistical analysis: Student's t test. (B) Serum levels of human IgG in cynomolgus monkeys receiving a single i.v. dose of 10 mg/kg (closed triangles), 1 mg/kg (open circles) or 0.1 mg/kg (closed circles) CALY-002. Results are expressed as mean ± SD for 3 to 4 animals per group. (C) CALY-002 reduces circulating NK cell numbers in cynomolgus monkeys. Following a single dose injection of 10 mg/kg (closed triangles), 1 mg/kg (open circles) or 0.1 mg/kg (closed circles) CALY-002, animals underwent a 4-wk observation period and NK cell counts were determined by flow cytometry at Day −3 (pre-dose), and 1, 3, 5, 8, 14, 21 and 28 d after treatment. Data are plotted as mean absolute number of blood CD3−CD16+ cells NK cells ± SD for 3 to 4 animals per group.