Figure 6.

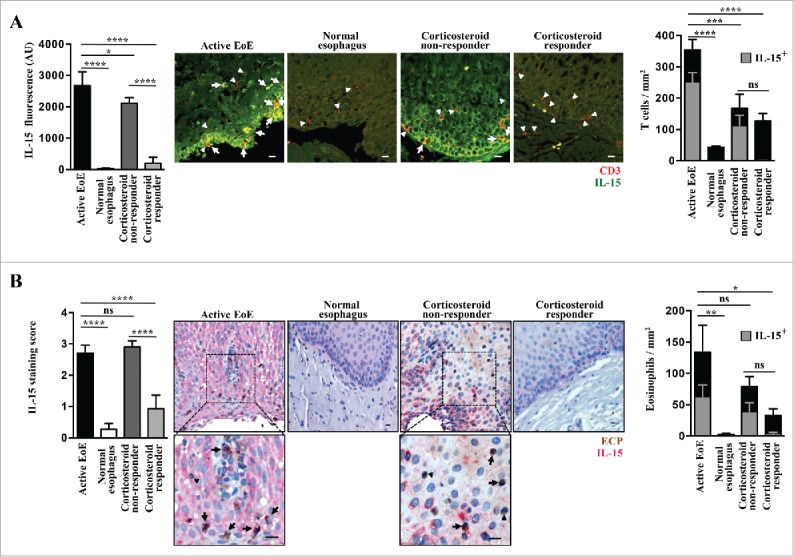
Increased IL-15 protein expression in esophageal biopsies from active EoE patients. (A) Immunofluorescence. Staining for IL-15 (green) and CD3 (red) was performed in 4 active EoE patients [4 x proximal and 4 x distal tissue samples], 2 normal control individuals [2 x proximal and 2 x distal tissue samples], 3 corticosteroid responders [3 x proximal and 3 x distal tissue samples] and 2 corticosteroid non-responders [2 x proximal and 2 x distal tissue samples]. Representative images are shown for each group. White arrows indicate examples of double stained cells, and filled white triangles indicate T cells without detectable IL-15 staining. Scale bars, 10 μm. Quantification of IL- 15 expression in epithelial cells is shown in the left panel. The right panel shows the quantitative analysis of infiltrating T cells that were either IL-15 negative (black bars) or positive (gray bars). (B) Immunohistochemistry. Staining for IL-15 (red) and ECP (brown) in active EoE, normal control individuals, corticosteroid responders, and corticosteroid non-responders (same esophageal tissues as described in panel A). Representative images are shown for each group. Insets demonstrate infiltrating eosinophils that are positive for IL-15 (black arrows) or IL-15 negative (filled black triangles). Scale bars, 10 μm. The right panel shows the quantitative analysis of infiltrating eosinophils that were either IL-15 negative (black bar) or positive (gray bar). Statistical analysis: one-way ANOVA followed by Tukey's multiple comparisons. ****p < 0.0001; ***p < 0.001; **p < 0.01; *p < 0.05.
