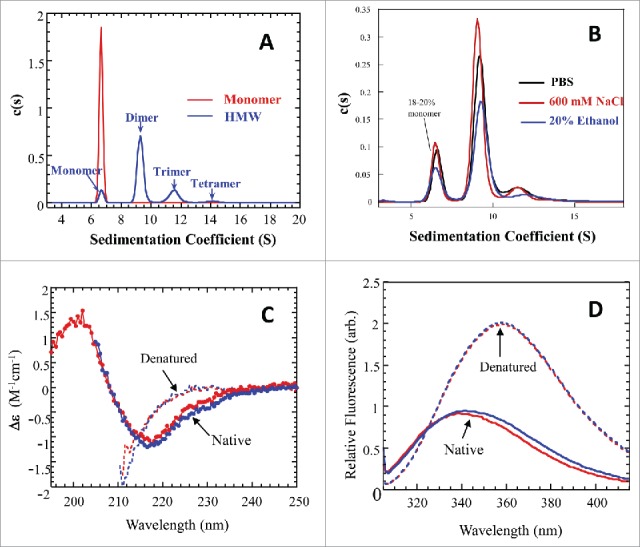
Figure 2.

Biophysical characterizations for the cHA column purified monomer and cHA column enriched HMW fraction. (A) Overlay of analytical ultracentrifugation sedimentation velocity (AUC-SV) profiles for the purified monomer (red) and the enriched HMW species (blue). The total protein concentrations were 0.4–0.5 mg/mL. (B) Overlay of AUC-SV profiles for the enriched HMW species in PBS (black), 600 mM NaCl (red), and in the presence of 20% ethanol (blue). The samples were obtained by ∼5-fold dilution of the HMW sample in (A) with appropriate reagents. The profiles are not normalized with respect to sample concentrations. The sedimentation coefficients in (A) and (B) were corrected for the standard state of water at 20°C. The instrumentation and experimental procedures for AUC-SV were as described previously.9 (C) Overlay of far-UV CD spectra for the monomer (red) and enriched HMW species (blue) in formulation buffer (dots) and with 6 M GdmCl (dashed lines). The instrumentation and experimental procedures for far-UV CD were as described previously.9 (D) Overlay of intrinsic fluorescence emission spectra of the monomer (red) and enriched HMW species (blue) in formulation buffer (solid lines) and with 6 M GdmCl (dashed lines). Each curve in (C) and (D) represents triplicate measurements averaged at each data point.
