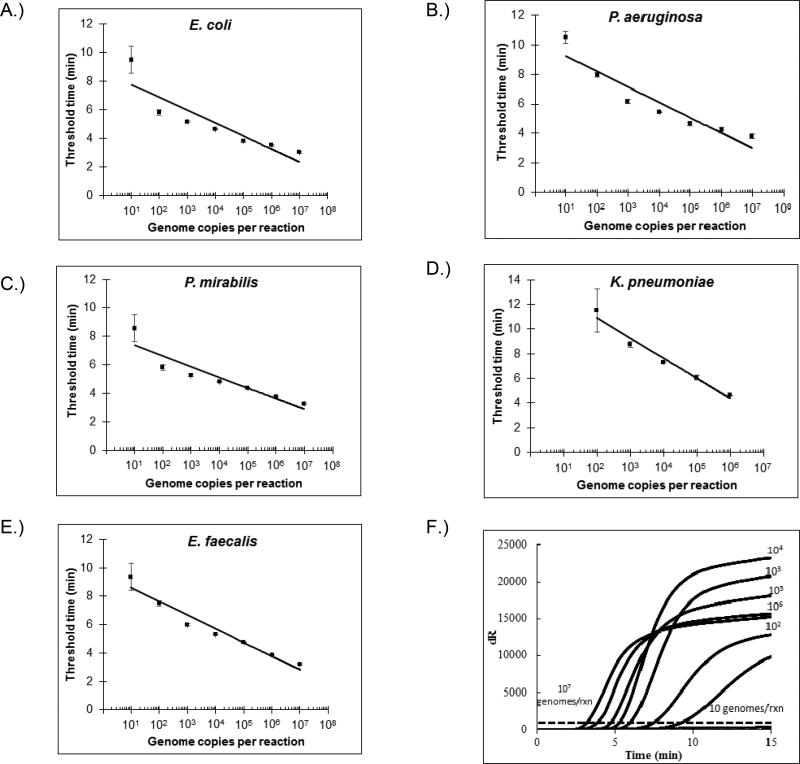
FIGURE 1. Analytical performance of real-time RPAs.
(A) – (E): semi-log regression lines for detection of different dilutions of pathogens included on the UTI panel. Data points were derived from three replicates for 103 or more genome copies per reaction, and six replicates for 10 and 102 genome copies per reaction. (F) Representative amplification curves, averaged from three replicates, of different dilutions of E. faecalis gDNA.

