
Figure 2.
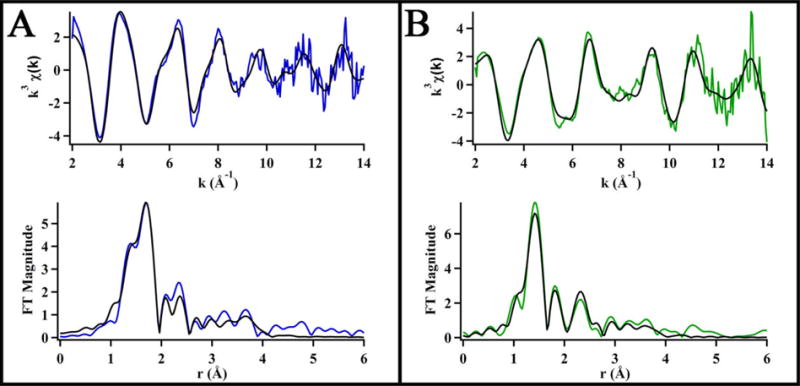
Data (in color) and best fit models (in black) of the Ni K-edge EXAFS represented in k3-weighted unfiltered data (top) and Fourier transformed (k = 2 – 14 Å−1) data uncorrected for phase shifts (bottom) for (A) Ni,Zn-WT-HypA and (B) Ni,Zn- L2*-HypA in 20 mM HEPES, 200 mM NaBr, 1mM TCEP, pH 7.2.