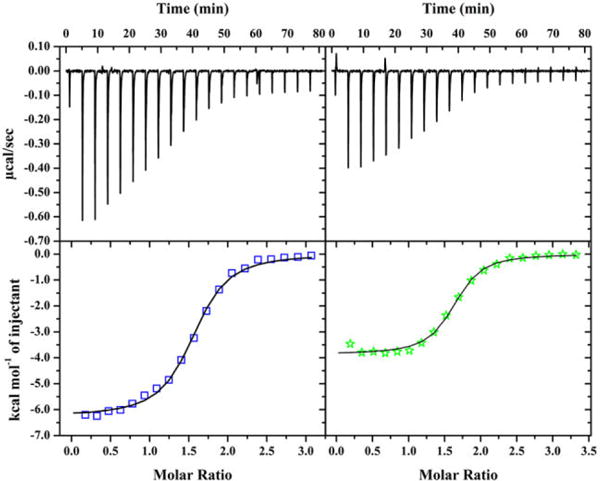
Figure 5.

ITC binding curves of WT- (left) or L2*-HypA (right) into UreE WT dimer in buffer with 20mM HEPES, 200mM NaCl, 1mM TCEP, pH 7.2. The top panels show the heat response from each injection, which are integrated to generate the enthalpy of binding plotted on the bottom panels (WT = circles; L2* = stars). Binding of WT- and L2*-HypA to UreE WT dimer are each fitted to OneSite models as described in the text.
