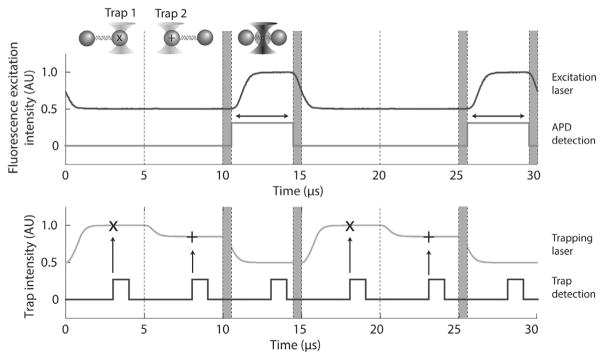
Fig. 3.
Interlacing and time-sharing timing. Trap 1 and trap 2 are ON each for 1/3 of the cycle and fluorescence excitation is ON during the final 1/3. Plotted are the laser intensities measured by feedback photodetectors QPD1 (traps 1 and 2; gray, bottom panel) and PD (fluorescence excitation; black, top panel). Traps 1 and 2 are set to different intensities for clarity. 625-ns delays (shaded regions) between turning OFF (ON) the optical traps and turning ON (OFF) the fluorescence excitation ensure no overlaps between light sources. Trap data acquisition occurs at the time points “x” and “+” for trap 1 and 2, respectively. A digital pulse (black, bottom panel) synchronous with trap data acquisition is output from the DAQ card to make temporal adjustments during alignment. The rising edge of a digital pulse is synchronous with the trap data acquisition (vertical arrows). A digital pulse (dark gray, top panel) synchronous with the APD fluorescence data acquisition is also output from the DAQ card. Emission photons are counted only during this time interval (horizontal arrow). Figure adapted from Comstock, M. J., Ha, T., & Chemla, Y. R. (2011). Ultrahigh-resolution optical trap with single-fluorophore sensitivity. Nature Methods, 8(4), 335–340 with permission from Nature Publishing Group.

