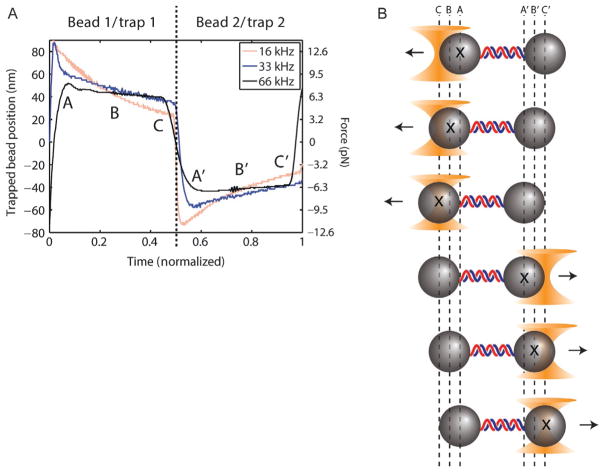
Fig. 5.
Bead motion during time-sharing period. Measurements of trapped beads’ positions during one time-sharing–interlacing cycle for three different time-sharing–interlacing rates (16, 33, 66 kHz). The time axis is normalized to 2/3 of the interlacing cycle duration, i.e., the time-sharing period (see Fig. 3) where trap 1 is ON for half and trap 2 is ON for the second half. Bead oscillations due to imbalanced forces (schematic) are minimized by faster time-sharing–interlacing rates. Data acquired in the middle of each trap ON period (points B and B′) give the correct average displacement and force, compared to data before (A and A′) or after (C and C′). Figure reproduced from Comstock, M. J., Ha, T., & Chemla, Y. R. (2011). Ultrahigh-resolution optical trap with single-fluorophore sensitivity. Nature Methods, 8(4), 335–340 with permission from Nature Publishing Group.

