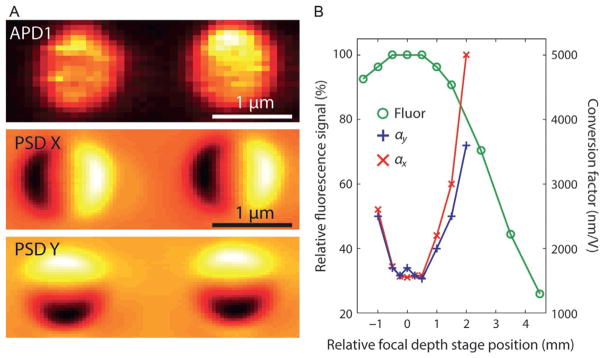
Fig. 6.
Spatial alignment of confocal excitation spot and optical traps. Two methods of alignment are shown. (A) Top panel: Lateral alignment by scanning the confocal spot (using SM) over two trapped beads. Signals resulting from bead fluorescence are recorded by APD1 (yellow: higher fluorescence intensity). Middle and bottom panels: Lateral alignment by scanning confocal spot laser over two trapped beads. Here, the PSD measures the deflection in x (middle) and y (bottom) of the laser as it is scanned [black (yellow) denotes negative (positive) deflections]. (B) Axial alignment by two methods. Circles: Axial alignment by scanning the focal depth of the confocal spot (using the translational stage in T4) over a trapped fluorescent bead. The fluorescence intensity measured by APD1 is maximized when the spot is aligned in the plane of the trapped bead. Crosses and exes: Axial alignment by scanning the confocal spot depth over a trapped bead. Here, the PSD voltage-to-bead position conversion factors, α, derived from trap calibration are minimized when the spot is aligned in the plane of the trapped bead.

