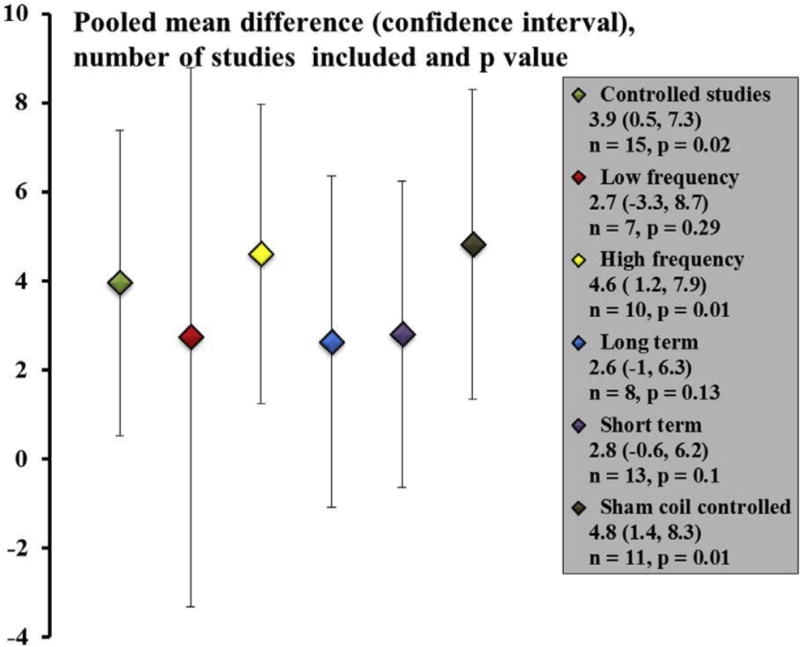
Figure 2.

Pooled mean difference between treatment and control groups with baseline values ignored. The figure shows all controlled studies together and then presents data when individual factors such as low-frequency, high-frequency, long- and short-term follow-up, and studies that specifically included a sham coil were separately examined. The scatter plot shows the point estimates with 95% confidence interval error bars. The number of studies included, and the P value for each comparison is presented.
