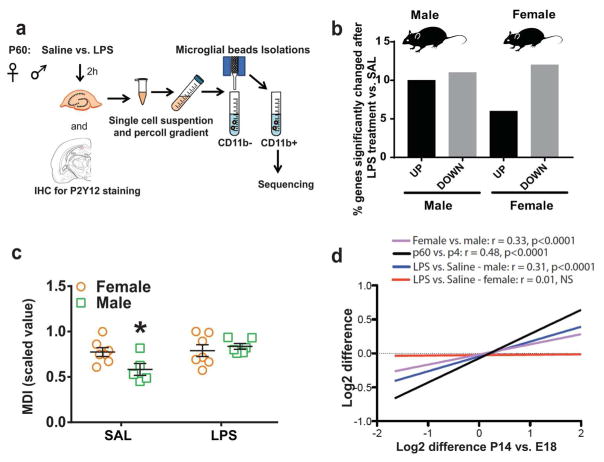
Figure 2. Sex differences in microglial response to LPS.
(a) C57BL/6 male and female P60 mice were sacrificed 2 hours after saline or LPS (330 ug/kg, i.p.) injections following which microglia were isolated from the hippocampus and subject to RNA sequencing. (b) Out of the total number of genes changed in males and females following LPS treatment, about 21% (10% up and 11% down) were changed significantly in males (vs. male SAL), and 16% (5% up and 11% down) were changed significantly in females (vs. female SAL). (c) Microglial developmental index was calculated for P60 samples as described above (two-way ANOVA, post-hoc * p < 0.05, n = 6–8 per group). (d) Gene expression changes between P14 and E18 were compared with those in P60 vs. P4 (black line, linear regression, Pearson’s r = 0.48, *** p < 0.0001), P60 females vs. males (purple line, linear regression, Pearson’s r = 0.33, *** p < 0.0001), P60 male LPS vs. SAL (blue line, linear regression, Pearson’s r = 0.31, *** p < 0.0001) and P60 female LPS vs. SAL (red line, linear regression, Pearson’s r = 0.0.1, not significant).

