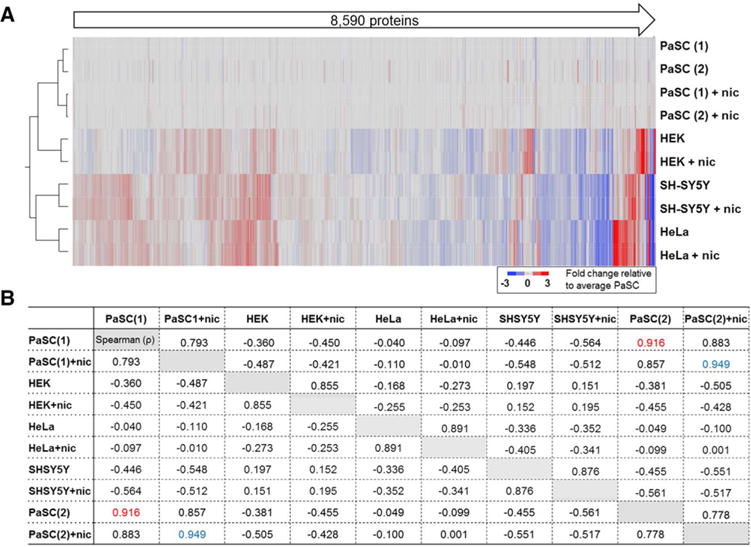
Figure 2.

Total of 8590 proteins were quantified by using the SPS-MS3 strategy. (A) Heat map and associated dendrogram of samples analyzed in the TMT10-plex experiment. Data were normalized to the average untreated PaSC samples. (B) Spearman correlation (ρ) matrix of protein abundance for all ten samples. Highlighted in red and blue are the correlations of the replicates for PaSC and PaSC+nicotine, respectively, both of which demonstrated ρ>0.9. nic, nicotine.
