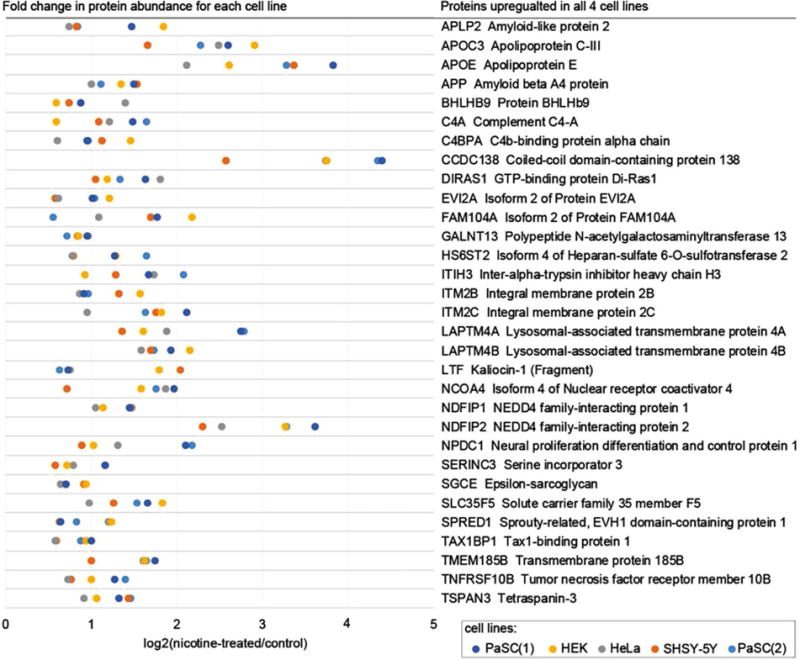
Figure 4.

Proteins (n = 31) demonstrating a significant increase in abundance following nicotine treatment in all four cell lines. Heat map scale is the percentage of the total abundance of a protein across all ten channels.

Proteins (n = 31) demonstrating a significant increase in abundance following nicotine treatment in all four cell lines. Heat map scale is the percentage of the total abundance of a protein across all ten channels.