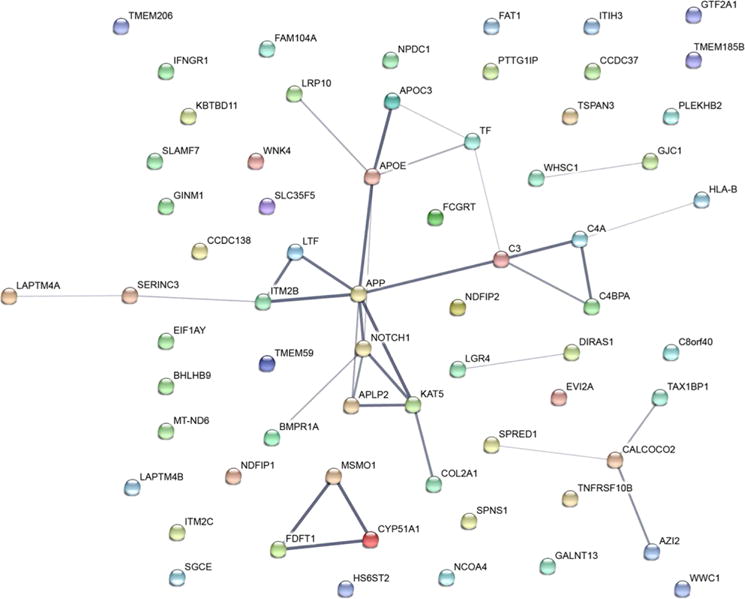
Figure 6.

Network of 65 proteins that demonstrate differences in abundance (fold change ≥1.5). Line thickness of the edges indicates the strength of data supporting the interactions. Analysis was performed by using String [60] and evidence connecting nodes included experiments, databases, co-expression, neighborhood, gene fusion and co-occurrence.
