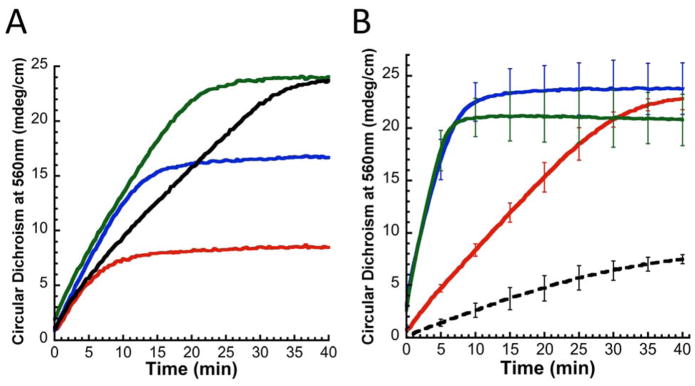
Figure 8.
A) Change in Circular Dichroism signal at 560 nm for 50 μM fIscU monomer and 10 μM Nfs1-Isd11 monomer under varying Fe(II) concentrations: 25 μM (red), 50 μM (blue) 75 μM (green), 100 μM (black). Maximal yield at 1.5 x Fe suggests fIscU forms two FeS clusters per dimer. Free Fe2+ inhibits FeS-fIscU formation by facilitating FeS-mineralization. B) FeS-fIscU formation via 50 μM apo-fIscU in the presence of 10 μM Nfs1-Isd11 (black), 10 μM Nfs1-Isd11 and 10 μM Yfh1 (blue), and 10 μM Nfs1-Isd11, 10μM yIsu1, and 10μM Yfh1 (green); all proteins overexpressed in E. coli. The rate of FeS-fIscU formation increases in the presence of Yfh1 (blue) to a similar extent as observed with Yfh1 and yIsu1 (green). FeS-cluster formation using 50 μM apo-yIsu1 in place of 50 μM apo-fIscU is included as a comparison (black-dashed).

