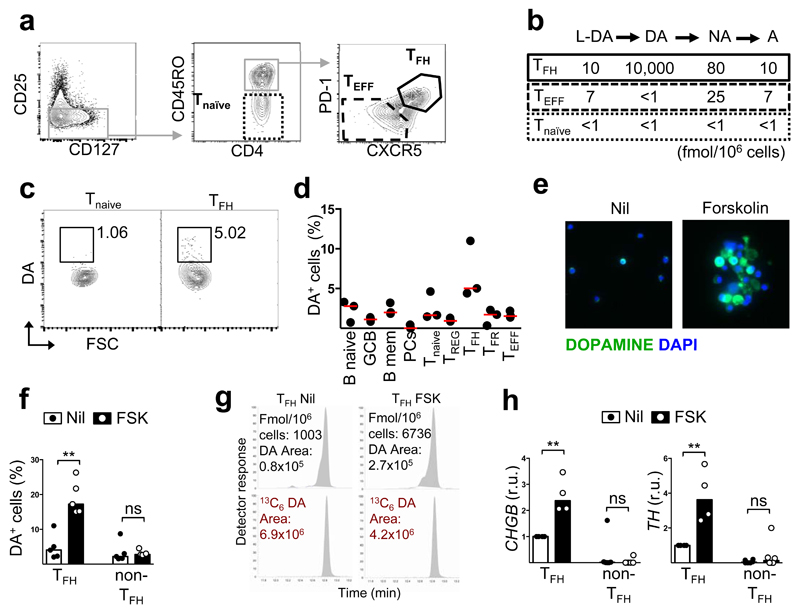
Fig. 2. Human TFH cells produce dopamine.
a, Gating strategy for sorting T cell subsets from human tonsil. b, Quantification of catecholamines by GC/MS/MS (n=2). c, Representative dopamine FACS stain. d, Quantification of DA-expressing cells (n=3). e, Representative immunofluorescence dopamine stains of TFH cells untreated or treated with forskolin (FSK) (n=5). f, DA expression in untreated or FSK-treated TFH and non-TFH (effector and naïve T). (n=5). g, Representative GC/MS/MS peaks showing DA content in FSK-treated and untrated TFH cells compared to internal standard (13C6-labelled DA), which controls for losses during extraction. h, CHGB and TH mRNA expression by qPCR (normalised to RPL13A) in FSK-treated TFH and non-TFH cells. r.u., relative unit. (n=3). f,h, Bars represent median values; each dot represents one donor. ns, not significant and **p ≤ 0.01; Mann-Whitney test.

