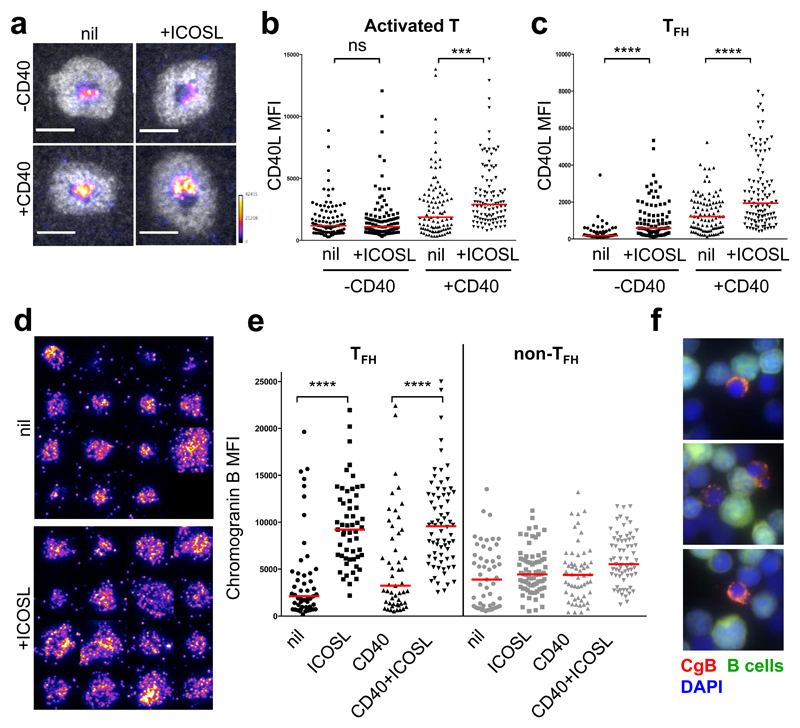
Fig. 5. Effects of ICOS ligation at the immunological synapse.
a, Representative images of ICAM-1 ring (white) around CD40L (pseudocolor scale) in the presence or absence of CD40 and ICOSL at physiological densities on the supported lipid bilayer (SLB) containing ICAM-1 and UCHT1. Scale bar 5 µm. b, c, Plots represent CD40L MFI of individual activated human T (b) or TFH (c) cells forming synapses (n=3). d, Representative images of chromogranin B stain in the presence or absence of ICOSL at the immunological synapse. e, Plots represent CgB fluorescent intensity of individual activated TFH and non-TFH cells forming synapses (n=3). b,c,e, ns, not significant, (***p ≤ 0.001) and (****p ≤ 0.0001) nonparametric Mann-Whitney test (U test). f, Representative images of CgB+ TFH cells (red) forming synapses with allogeneic B cells (green).

