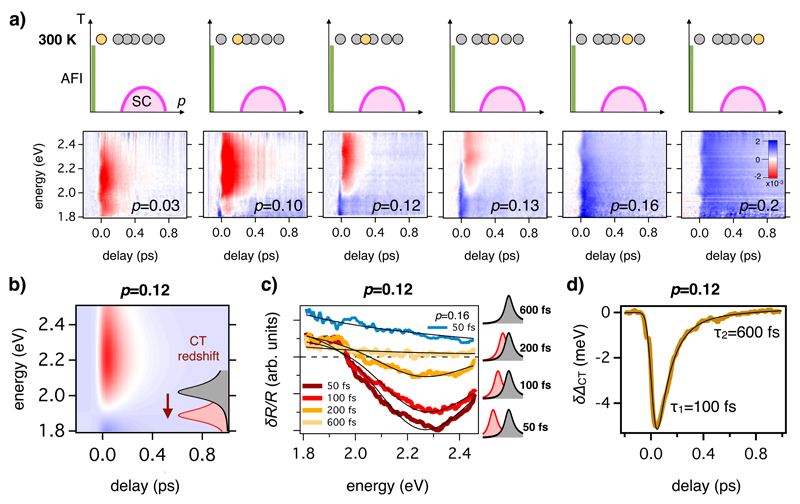
Figure 2. Ultrafast optical spectroscopy on La-Bi2201.
a) The top row shows the position of the measured samples in the p-T phase diagram. In the bottom row we report the δR(ω,t)/R maps measured by ultrafast optical spectroscopy on La-Bi2201. The colour scale is reported in the inset. b) Simulation of the δR(ω,t)/R signal for the p=0.12 sample. A transient redshift of the CT oscillator, described by an exponential decay, is assumed. The colour scale is the same than that in panel a). c) δR(ω)/R spectra at different time delays for the p=0.12 sample. The black line is the fit to the data obtained by red-shifting the position of the CT oscillator. For comparison, we report δR(ω)/R for the p=0.16 sample (blue line), along with the best fit obtained by increasing the scattering rate in the Drude model. d) Dynamics of δΔCT for the p=0.12 sample. The black line is the fit to the data of a double-exponential decay convoluted with a step function.

