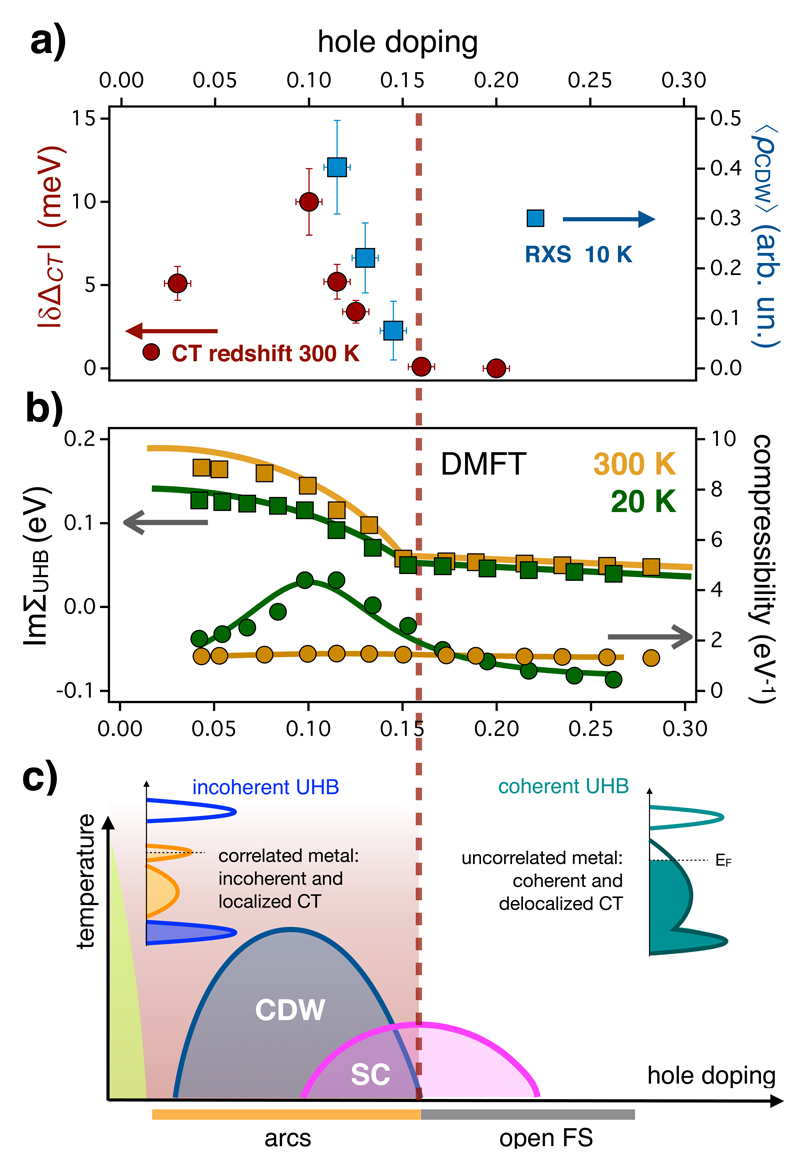
Figure 3. The high-energy phase diagram of cuprates.
a) The values of the room-temperature CT redshift (δΔCT, red dots, left axis) and the intensity of the low-temperature CDW signal (〈ρCDW〉, blue dots, right axis) are reported as a function of the hole concentration of the La-Bi2201 samples. The excitation fluence of the pump beam has been tuned in order to maintain a constant absorbed energy density of 7 J/cm3 for the different dopings (see Supplementary). The error bars correspond to the uncertainty of the excitation fluence. 〈ρCDW〉 has been obtained by integrating the difference between the RXS signals measured at the temperatures of 20 K and 300 K at the CDW wavevector17. The error bars represent the standard deviation of the total number of counts in the integration area. The result has been normalized to the total RXS signal at 300 K. Both δΔCT and 〈ρCDW〉 vanish at the critical doping pcr =0.16±0.01. The uncertainty in the doping concentration represents the maximum and minimum values compatible with the nominal La concentration (x) and the experimental critical temperature, following the procedure described in Ref 53. b) The imaginary part of the electronic self-energy of the UHB (colored squares) is calculated by DMFT and is reported as a function of the doping concentration for different temperatures (300K dark yellow; 20 K green). The calculated electronic compressibility is indicated by colored circles. The full lines are guides to the eye. c) A sketch of the non-equilibrium p-T phase diagram of copper oxides is reported. The pink, blue and green areas delimit the superconducting (SC) dome, the charge-ordered (CDW) state and the antiferromagnetic insulator, respectively.

