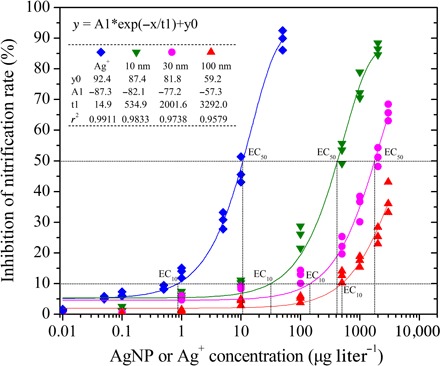
Fig. 1. Percentage reduction of nitrification rate in AgNP or Ag+ treatments compared to the no-silver control (incubation time = 12 hours; n = 3).

EC10 and EC50 represent the concentrations that produced a 10 or 50% reduction in nitrification rate relative to the control, respectively. Nonlinear fitted curves (ExpDec1) and equations are given (P < 0.01).
