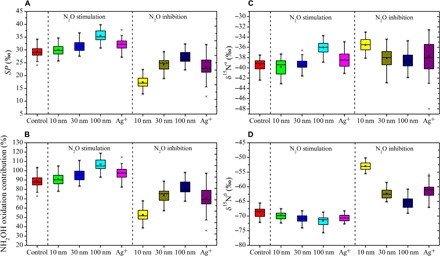
Fig. 3. Identification of key N2O production pathways.

(A) SP values. (B) Contribution of NH2OH oxidation pathway to N2O emission. (C) Isotopomer ratios at the central site of N2O. (D) Isotopomer ratios at the end site of N2O. Horizontal lines indicate the median, five-point stars show the mean, asterisks indicate outlier, the boxes give the 25th and 75th percentiles, and whiskers show range from the 5th to 95th percentile. Control group represents the incubation without silver. The 10 nm, 30 nm, 100 nm, and Ag+ in the “N2O stimulation” area represent the incubations with AgNPs (100 μg liter−1, 10 nm; 500 μg liter−1, 30 nm; and 1000 μg liter−1, 100 nm) and Ag+ (5 μg liter−1), wherein 43.0, 84.1, 121.5, and 73.9% of N2O emission enhancement were detected, respectively. The 10 nm, 30 nm, 100 nm, and Ag+ in the “N2O inhibition” area represent the incubations with AgNPs (2000 μg liter−1, 10 nm; 3000 μg liter−1, 30 nm; and 3000 μg liter−1, 100 nm) and Ag+ (500 μg liter−1), wherein 89.9, 48.3, 19.0, and 59.3% of N2O emission inhibition were detected, respectively. The incubation time was 12 hours.
