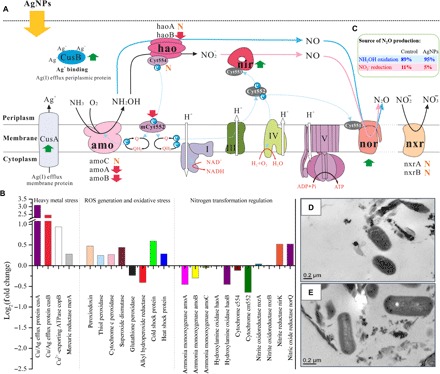
Fig. 4. Response of nitrifying communities to AgNP exposure.

(A) Schematic model depicting the effects of AgNPs on the expression of gene families involved in nitrification. N2O can be produced through NO2− reduction (the bold pink arrows) or incomplete NH2OH oxidation (the bold blue arrows). Upward green arrows indicate that the gene expressions were up-regulated when exposed to AgNPs, the downward red arrows indicate that the gene expressions were down-regulated, and “N” denotes that gene expression was not affected by AgNP exposure. CusA, Cu(I)/Ag(I) efflux system membrane protein cusA; CusB, Cu(I)/Ag(I) efflux system periplasmic protein cusB; amo, ammonia monooxygenase; hao, hydroxylamine oxidase; Cyt554, cytochrome c554; mCyt552, cytochrome cm552; nir, nitrite reductase (NO-forming) nirK; nor, nitric oxide reductase norQ; nxr, nitrite oxidoreductase; Cyt551, cytochrome c551; Cyt552, cytochrome c552; Cyt553, cytochrome c553; Q, ubiquinone; QH2, ubiquinol. The roman numbers refer to the enzyme complex I (NADH-ubiquinone reductase), complex III (ubiquinol-cytochrome c reductase), complex IV (cytochrome c oxidase), and complex V (F-type ATPase) in the respiratory chain (related gene expression regulations by AgNPs are shown in fig. S12). Colored proteins were detected in the cDNA libraries, whereas those in dark gray were not identified but are included in the model of electron transport for reference (74). Dotted blue arrows show the movement of electrons, and white arrows show movement of protons. The membrane was broken by dotted line, as nitrite oxidation did not often occur in the same organism with ammonia oxidation, with the exception of recently discovered comammox Nitrospira (55, 56). (B) Fold change (FC) of transcripts encoding proteins involved in heavy metal stress response, oxidative stress release, and the nitrogen transformation process of nitrifying organisms when exposed to 30-nm AgNP (500 μg liter−1) for 12 hours. FC in relative gene expression was calculated by comparing AgNP-treated samples to the no-silver control. Gene expression levels were calculated on the basis of FPKM. (C) Contribution of different pathways to N2O emission in the no-silver control and the 30-nm AgNP (500 μg liter−1) treatment. (D) TEM image of the no-silver control at 12 hours. (E) TEM image of the 30-nm AgNP (500 μg liter−1) treatment at 12 hours. No apparent physical damage to the cell surface was observed.
