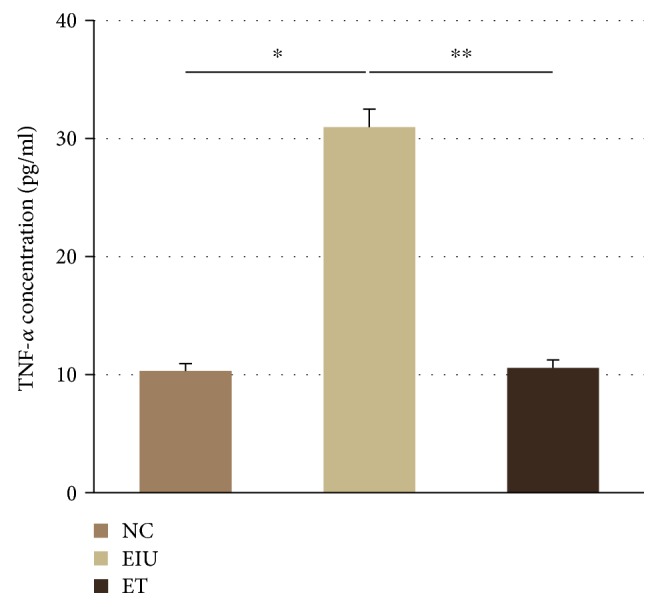
Figure 3.

Expression of TNF-α in aqueous humor. All data shown as mean ± standard deviation (n = 10). ∗p < 0.05 the EIU group versus the NC group; ∗∗p < 0.05 the ET group versus the EIU group.

Expression of TNF-α in aqueous humor. All data shown as mean ± standard deviation (n = 10). ∗p < 0.05 the EIU group versus the NC group; ∗∗p < 0.05 the ET group versus the EIU group.