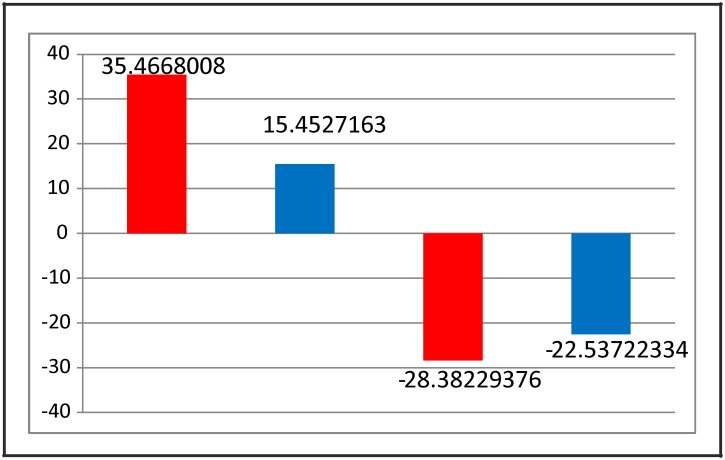
Fig 5. Link statistics.
The bars represent the deviation from the expected number of links per cluster, the expected being calculated assuming independence. First two columns show the stabilizing links and the next two columns show the destabilizing links for the two clusters. The red and blue bars represent the insulin sensitive and the insulin resistant basins of attraction, respectively.

