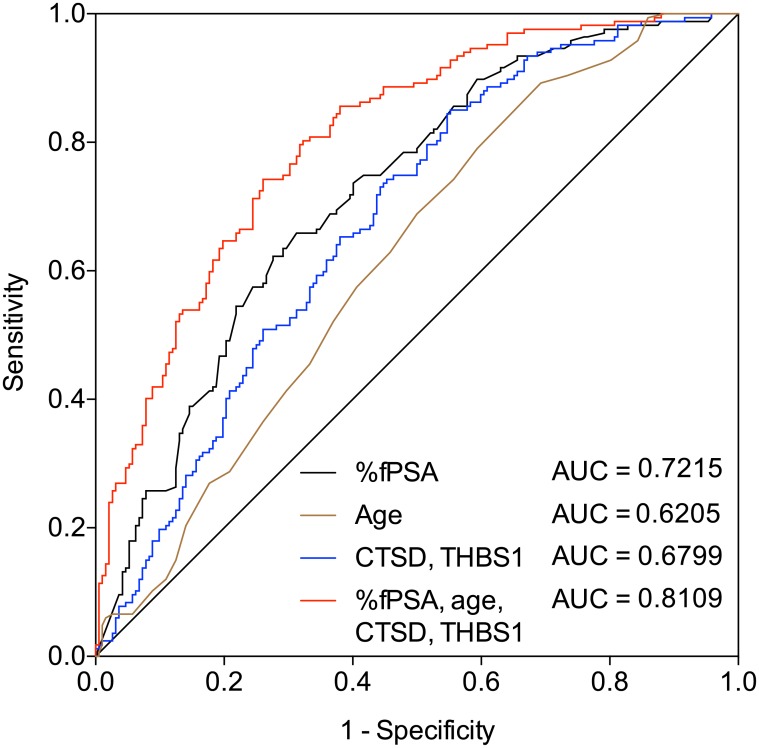
Fig 4. Receiver operating characteristics (ROC) analysis of different models.
ROC curves depicting the accuracy in predicting PCa in 359 men who had PSA levels of 2–10 ng/ml (192 PCa negative and 167 PCa positive cases). ROC curves highlight benefits of the CTSD and THBS1 alone (blue line), %fPSA (black line), age (brown line) and the combination of %fPSA, age, CTSD and THBS1 (red line).

