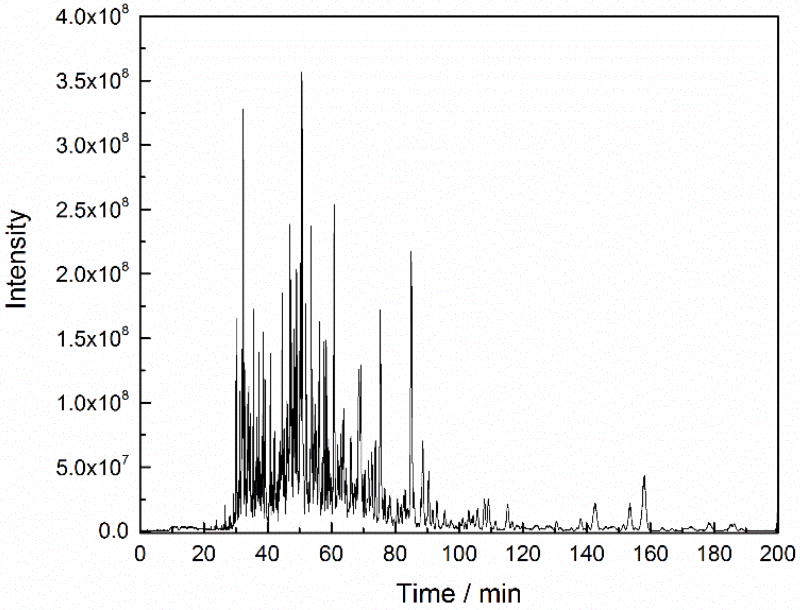
Figure 3.
Representative electrophorogram of CZE-ESI-MS/MS analysis of the HeLa digest. Experimental conditions: Q Exactive HF mass spectrometer; 50 µm i.d. × 150 µm o.d. × 100 cm long LPA coated capillary; 25 ng HeLa digest; 1 M HAc separation buffer; 21.6 kV separation voltage; and 1.6 kV spray voltage.

