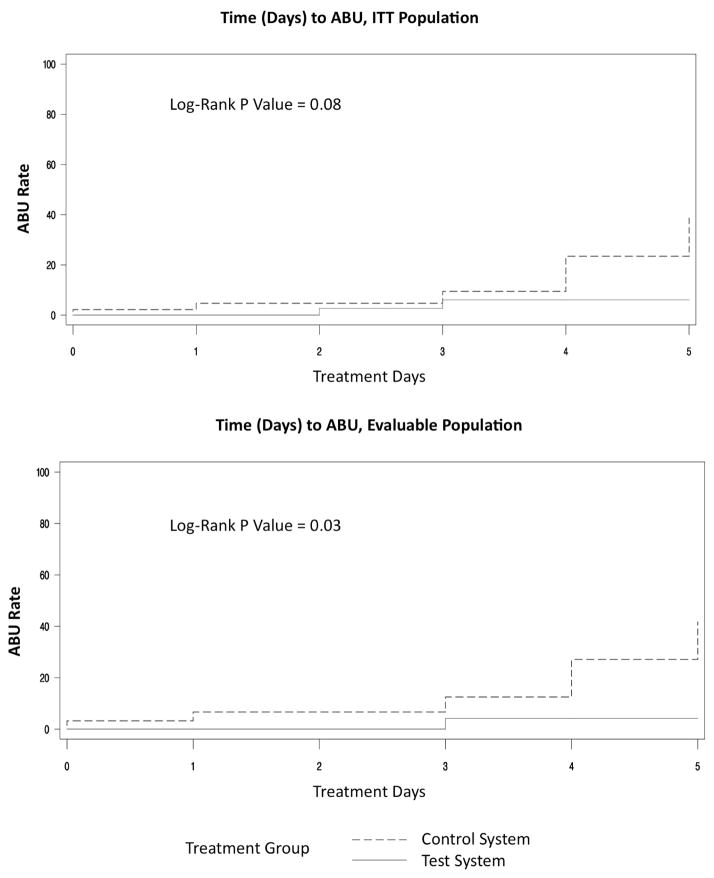
Figure 3. Time to asymptomatic bacteriuria (ABU) for intention-to-treat (ITT) population (top) and evaluable population (bottom).
According to the log rank text, time to ABU among test system recipients (solid line) vs. control subjects (dashed line) was borderline significantly longer in the ITT population (top), and significantly longer in the evaluable population (bottom).

