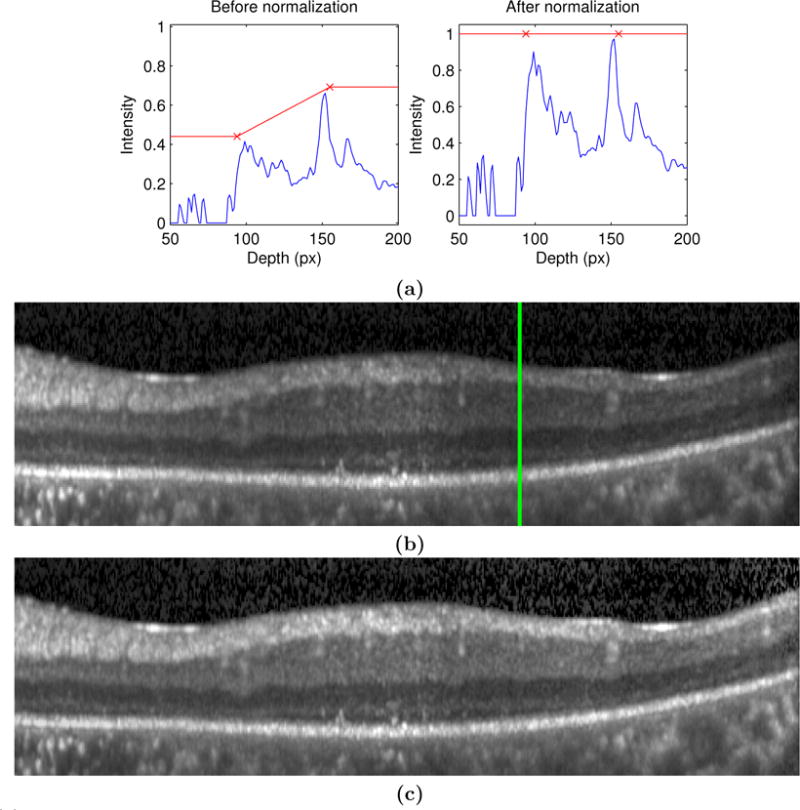
Figure 2.

(a) On the left and right are A-scan profiles before and after normalization, respectively. The red ×’s show the estimated intensity values for the ILM and BrM. B-scan images before and after normalization are shown in (b) and (c) (respectively), where the green line represents the A-scan shown in (a).
