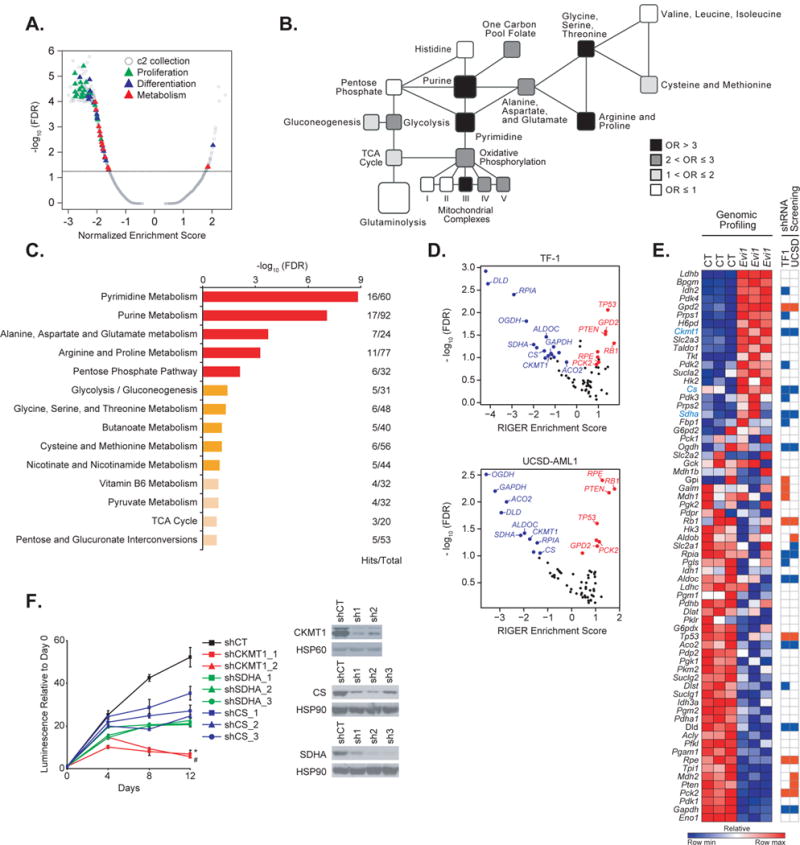
Figure 1. EVI1 overexpression imparts new metabolic dependencies on AML cells.

(A) Quantitative comparison by GSEA of the c2 collection of curated gene sets available from MSigDB v.5.0 for murine LinLow Evi1-overexpressing versus control bone marrow samples (GSE 34729). Data are presented as a volcano plot of −log10 (FDR) versus the normalized enrichment score for each evaluated gene set. Triangles indicate sets related to proliferation (green), cell differentiation (blue), and metabolism (red), and gray dots indicate all other c2 gene sets.
(B) Metabolic network showing gene sets altered in the Evi1 overexpression signature generated from GSE 34729. Black, dark grey, light grey, and white colors indicate an enrichment odds ratio (OR) above 3, between 2 and 3, between 1 and 2, and below 1, respectively.
(C) Pathway analysis integrating enrichment and pathway topology analyses (MetaboAnalyst) of the steady-state metabolite profile from control versus Evi1-overexpressing LinLow murine bone marrow cells. Top 15 out of a total of 45 metabolic pathways are represented based on a FDR ≤ 0.1 and p value ≤ 0.05. “Hits” represents the number of metabolites that scored in the steady-state profile and “Total” represents the number of metabolites present in the given metabolic pathway. Metabolic pathways with a - log10 (FDR) ≥ 1.5 are depicted in red, 1 ≤ − log10 (FDR) < 1.5 are in orange, and − log10 (FDR) < 1 in beige.
(D) Scatterplot of hits significantly depleted (in blue) or enriched (in red) from an shRNA library targeting 67 metabolism-related genes in the human TF-1 (top) and UCSD-AML1 (bottom) cell lines. Hits which did not score are depicted in black. Data are presented as volcano plots of −log10 (FDR) versus the RIGER enrichment score for each gene.
(E) Heatmap of the metabolism genes differentially expressed by genomic profiling in GSE 34729 upon Evi1 overexpression in LinLow bone marrow cells (left panel), and heatmap of genes either depleted (in blue) or enriched (in red) in the shRNA screen in TF-1 and UCSD-AML1 cells (right panel). Shown in blue text are genes both upregulated upon Evi1 overexpression and depleted in the shRNA screen. CT, control. Each column for each condition represents a technical replicate (n=3 per condition).
(F) Growth of TF-1 cells infected with hairpins directed against either CKMT1, SDHA, or CS (left panel). Immunoblot confirming shRNA target knockdown (right panel). shCT, control shRNA. Error bars represent mean ± SD. * and # p value ≤ 0.05 was calculated on the latest time point using a nonparametric Kruskall-Wallis test and Dunn’s multiple comparisons test. Data are representative of two independent experiments.
