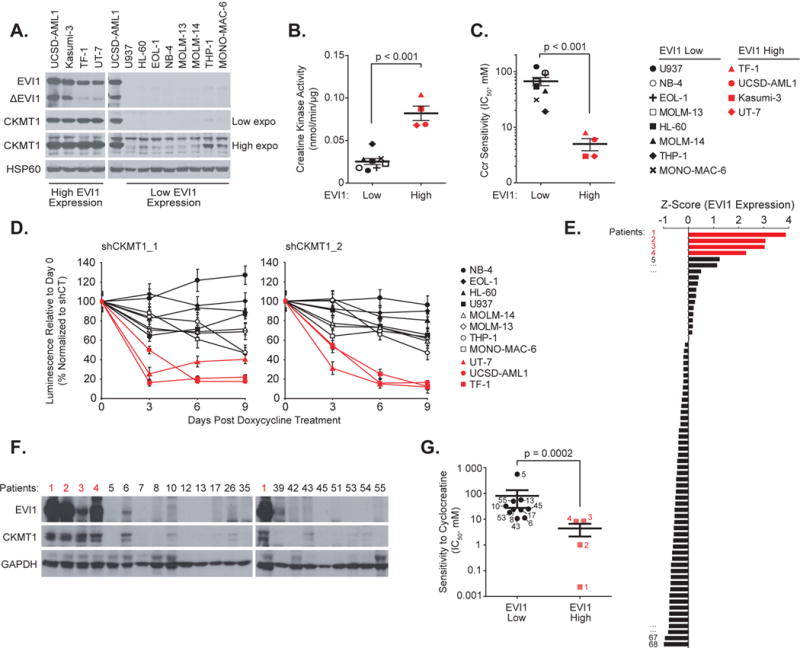
Figure 2. EVI1-positive cells highly express and are dependent on CKMT1.

(A) Immunoblot for EVI1, CKMT1, and HSP60 (loading control) from a panel of human AML cell lines with high or low EVI1 expression.
(B-C) Creatine kinase activity (B) and distribution of IC50 (C) for human EVI1 high versus low cell lines treated with cyclocreatine (Ccr). p value calculated using nonparametric Mann-Whitney test. Error bars represent mean ± SD of 8 low EVI1-expressing and four high EVI1-expressing human cell lines.
(D) Eleven human AML cell lines were infected with two CKMT1-directed miR30-shRNAs. Growth after treatment with 0.5 μg/ml doxycycline is normalized to the control shRNA and shown relative to day 0 (time of seeding), with error bars representing the mean ± SD of seven technical replicates. Each experiment in A–D was performed at least two independent times.
(E) Z Score normalization of EVI1 expression across a panel of CD13/33-gated bone marrow cells from 68 patient AML samples. Red bars indicate the four patients with the highest EVI1 expression level.
(F) Immunoblot for EVI1, CKMT1, and GAPDH (loading control) from bone marrow samples sub-selected from panel (E).
(G) Distribution of IC50 for EVI1 high versus low patient samples in response to treatment with cyclocreatine (Ccr). Red squares represent the four patient samples from panel (F) highlighted in red. p value calculated using nonparametric Mann-Whitney test. Error bars represent mean ± SD of 10 low EVI1-expressing and four high EVI1-expressing human primary samples.
