
Figure 3. Relationship between microbleeds and clinical and demographic features in atypical AD.
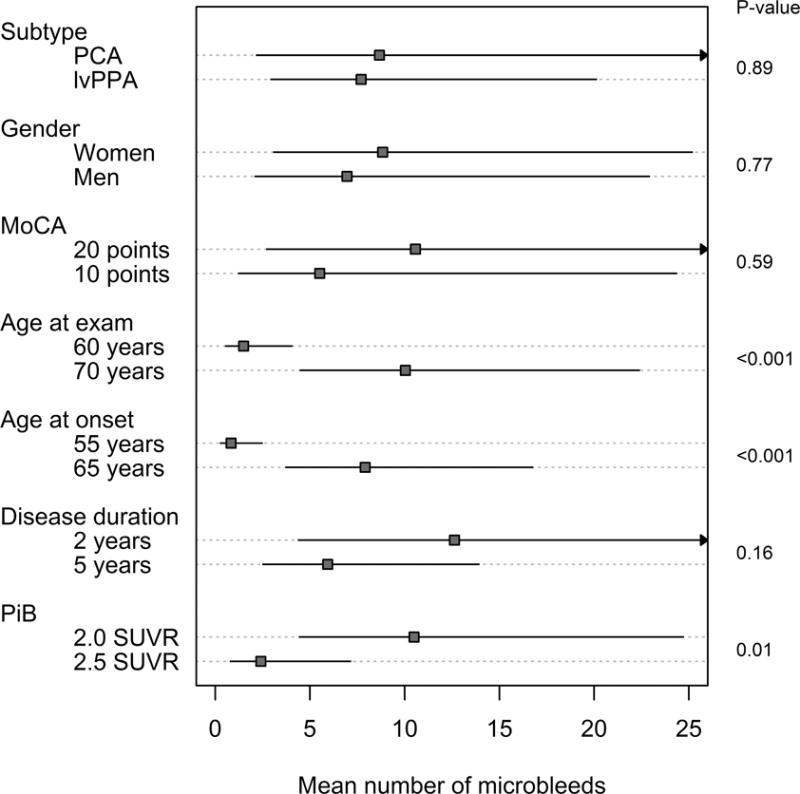
Estimated mean number of microbleeds with 95% confidence intervals based on negative binomial regression models. MoCA, age, disease duration, and PiB were modeled as continuous variables. To facilitate interpretation, we chose two clinically meaningful reference values for which to show the estimates.