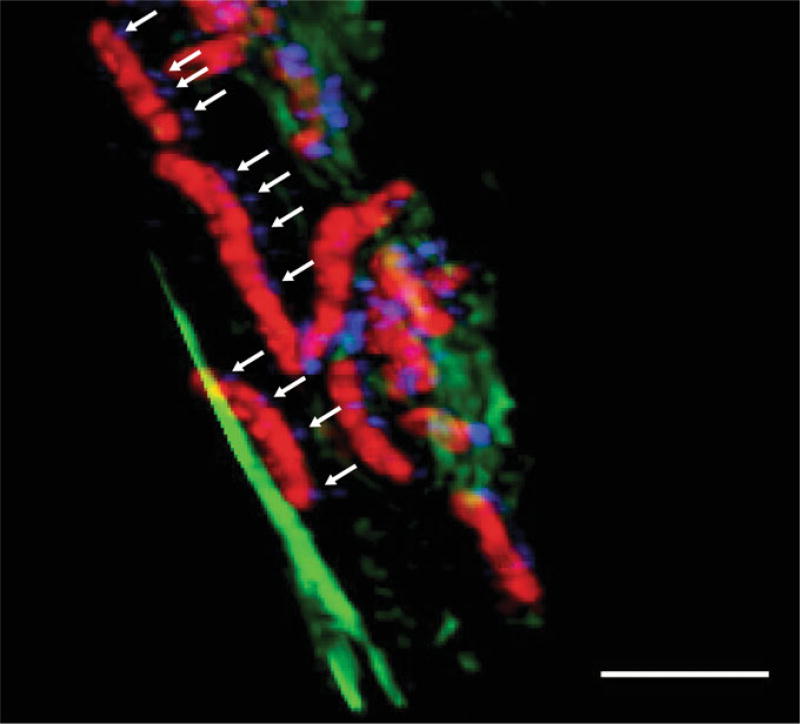
Fig. 2.
H. pylori DNA translocation: Confocal micrograph demonstrating H. pylori DNA translocation in the presence of host epithelial cells. H. pylori is shown in red, DNA in blue, and actin filaments in green. Arrows indicate areas of DNA exiting H. pylori. Scale bar, 2µm. Image acquired by Drs. Carrie Shaffer and Maria Hadjifrangiskou

