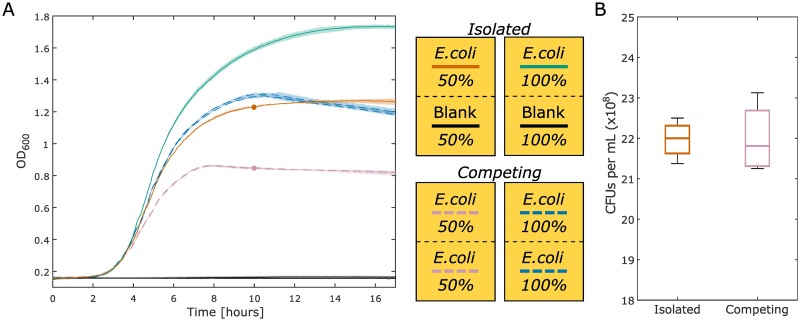
Fig 3. Comparison of isolated versus competing cultures.
(A) The green (100% LB) and orange (50% LB) lines are the isolated culture condition that have E. coli cultured on only one side of the membrane with blank media on the other. The OD for the side of the well that is not inoculated is plotted in black (it maintains the original OD; there is no growth, as expected). In this condition, E. coli has access to all of the nutrients on both sides of the membrane, but cell growth is physically constrained to one side. The blue (100% LB) and purple (50% LB) dashed lines are the competing culture condition that have E. coli cultured on both sides of the membrane. For the competing cultures, the growth curves from both sides are plotted individually. In this condition, each E. coli population must compete for the available nutrients. The maximum and minimum values of the generated growth curves, conducted in triplicate, are displayed as shaded regions around the plotted averages. (B) The biomass produced from the 50% LB isolated (solid orange) and competing (dashed purple) conditions at 10 hours is approximated by the CFU count of each culture. The CFU counts for the isolated condition as displayed are divided in half to compare to the competing condition, discussed further in the text. These data are the result of four experiments. The boxplot whiskers represent +/- 2.7σ from the mean.

