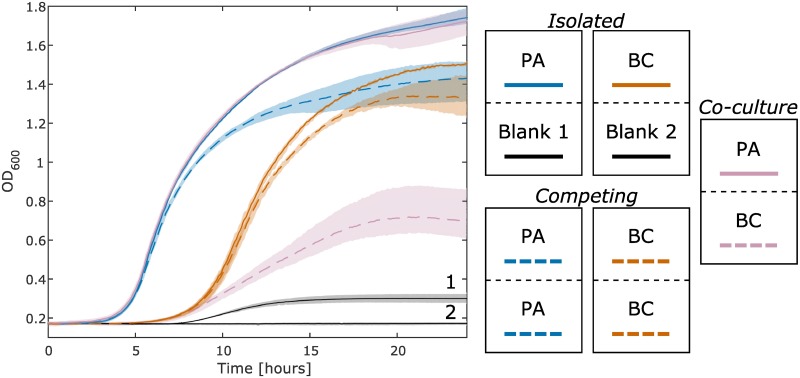
Fig 4. Growth curves of P. aeruginosa (PA) and B. cenocepacia (BC) in co-culture.
The culture conditions can be seen in the legend on the right side of this figure. All wells are started with 100% LB. The purple lines are gathered from the co-culture of PA and BC. The isolated PA and BC cultures are the solid blue and orange lines respectively. The black lines are controls from the side of the wells that were not inoculated for the isolated PA and BC cultures. The black line slightly increases (Blank 1) as a result of pyoverdine (produced by PA) that partially absorbs at 600 nm. This result is discussed further in the Supporting information (S2 Fig). The growth curves from each of the two competing PA and BC cultures (dashed blue and orange lines respectively) are nearly identical (similar to blue and purple in Fig 3) and thus are averaged to simplify the plot. The maximum and minimum values of the generated growth curves, conducted in triplicate (n = 3), are displayed as shaded regions around the plotted averages.

