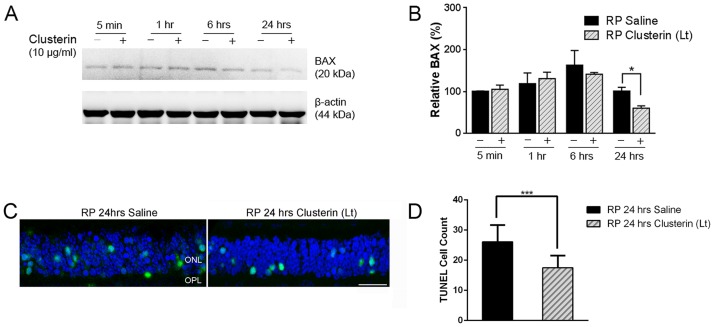
Fig 8. Suppression of Bax by clusterin in RP retina.
Bax expression level was evaluated by immunoblot analysis in saline- and clusterin-treated RP retinas (A). Retinas were collected at 5 min, 1 hour, 6 hours, and 24 hours after injection at P15. Bax expression was significantly decreased at 24 hours after clusterin injection (+) compared to 24 hours of saline injection (-). Densitometry analysis of Bax expression was shown by measuring the intensity relative to the control β-actin (B). Data represents mean ± SEM, * P = 0.0098. Confocal micrographs taken from vertical cryostat sections (10μm-thick) processed for TOPRO-3 staining (blue) and TUNEL staining (green) in the 24 hour saline-treated and 24 hour clusterin-treated P15 retinas. TUNEL positive cells were more visible in the saline-treated retinas compared to clusterin-treated retinas (C). Histogram showing the number of TUNEL positive cells in the different comparisons (i.e. RP 24hrs saline vs. RP 24hrs Clusterin (Lt), n = 5). Counts refer to TUNEL positive cells encountered within a linear extension of 150 μm at the mid-peripheral region of the retina. Data represents mean ± SEM,*** P = 0.0009.

