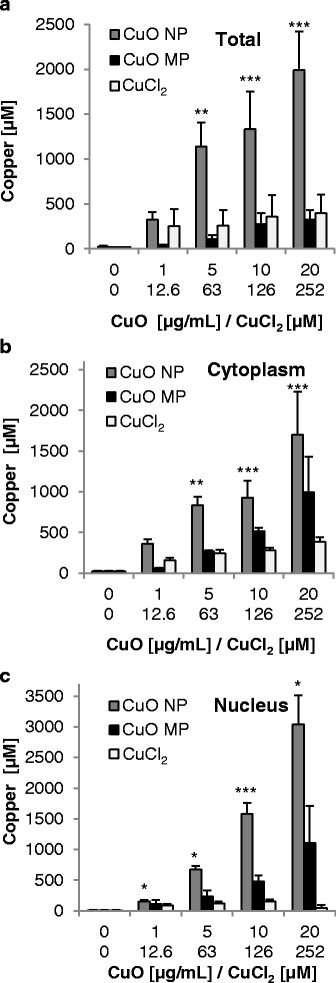
Fig. 2.

Cellular copper uptake and intracellular copper distribution after treatment with CuO NP, CuO MP and CuCl2. Copper content was determined in the soluble fraction of the total cell (a), the cytoplasm (b) and the nucleus (c) in BEAS-2B cells after 24 h treatment with the different copper compounds via GF-AAS. Shown are mean values of three independent experiments + SD ((a) and CuO NP (b,c)), mean values of six independent experiments + SD (10 μg/mL CuO NP (b,c)) or mean values of two independent experiments + R/2 (CuO MP and CuCl2 (b, c)). Statistically significant different from control: *p ≤ 0.05, **p ≤ 0.01, ***p ≤ 0.001 performed in case of (a) and CuO NP (b, c) (ANOVA-Dunnett’s T test). 20 μg/mL CuO are equal to 252 μM Cu2+. n.d.: not determined
