
Figure 3. Histone β-Hydroxybutyrylation is Metabolically Regulated by Cellular β-Hydroxybutyrate Levels.
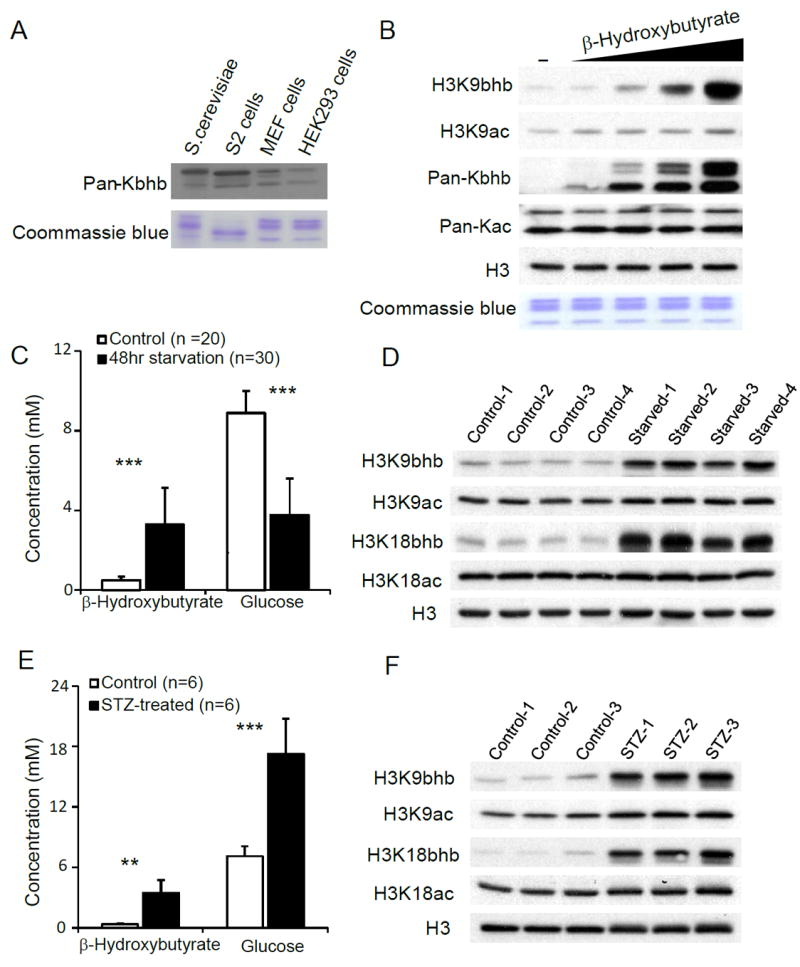
(A) Immunoblot analysis of histones from S. cerevisiae, D. melanogaster S2 cells, MEF cells, and HEK293 cells using pan anti-Kbhb antibody.
(B) Immunoblot analysis of histones from HEK293 cells treated with dose-increased sodium β-hydroxybutyrate.
(C) Blood glucose and β-hydroxybutyrate concentrations measured by a glucose-ketone meter from “fed” or “fasted” mice. Data are represented as means (±SEM). Twenty “fed” and 30 “fasted” mice were used. **P < 0.01, ***P < 0.001.
(D) Histone Kbhb and Kac levels in livers from “fed” or “fasted” mice were detected by Western blot using indicated antibodies.
(E) Blood glucose and β-hydroxybutyrate concentrations measured from “healthy” or “STZ-treated” mice. Data are represented as means (±SEM). Six pairs of healthy and streptozotocin (STZ) treated mice were used. **P < 0.01, ***P < 0.001.
(F) Histone Kbhb and Kac levels in livers from “healthy” or “STZ-treated” mice were detected by Western blot using indicated antibodies. See also Figure S3.