
Figure 3. Mouse N-Myc signature is clinically relevant.
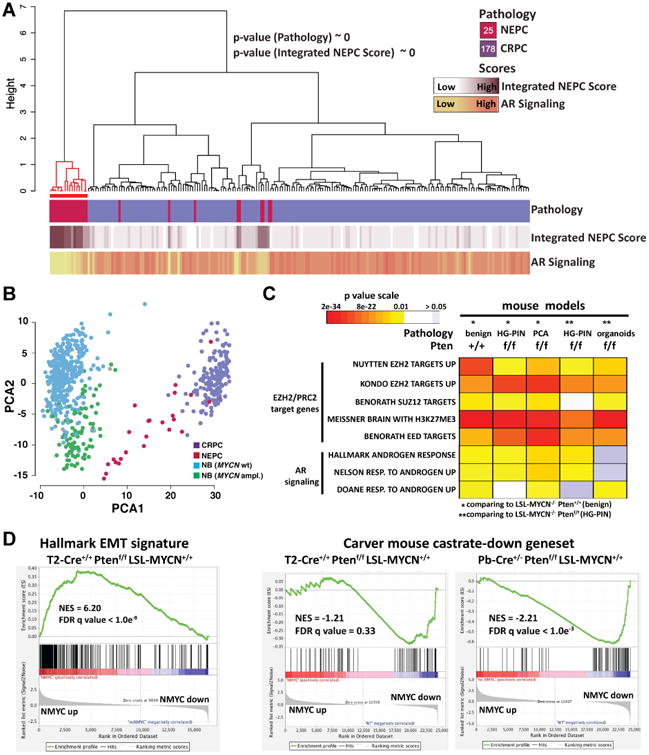
A Ward's hierarchical clustering of the normalized FPKM values of the 779 prioritized genes across 203 CRPCs samples from two independent cohorts (IPM Cornell 2011-15, SU2C-PCF 2015). Shown p-values results from the hyper-geometric test on CRPC-NE enriched cluster (red color). Pearson's correlation was used as distance measure for samples. Annotation tracks report pathology classification (top), values of Integrated NEPC Score (middle) and AR Signaling (bottom) (Darker colors indicate higher scores). The number of samples for each pathology classification is reported inside the square symbols of the corresponding legend. Red line indicates a subgroup enriched with pathology and NEPC score compared to rest of samples (hypergeometric mean p values are shown). The mouse N-Myc signature segregated the human samples into 2 groups, one significantly enriched with CRPC-NE samples based on pathological criteria (p value <10-20, hypergeometric test) that have high NEPC scores (p value ∼ 0, hypergeometric test). B. Projection of the expression levels of the 779 signature genes onto the first and second principal components analysis (PCA) of the 701 tumor samples RNA-seq data including 498 neuroblastoma (NB) samples (Zhang et al., 2015). Colors indicate tumor classes (CRPC, NEPC, NB with amplified MYCN, NB with WT MYCN). C. Heatmap of GSEA FDR q-values of AR induced genes and multiple PRC2 target gene sets that are significantly enriched in the N-Myc down-regulated genes identified in the indicated N-Myc expressing mouse genotypes compared to their non-N-Myc expressing counterparts. D. Right: GSEA enrichment plot of the hallmark EMT gene set with the corresponding statistical metrics shown; Left: GSEA enrichment plot of the Carver mouse gene set that represent genes that are down-regulated in mouse prostates cancer following castration (Carver et al., 2011). See also Figures S3 and Tables S2, S3.