Fig. 3.

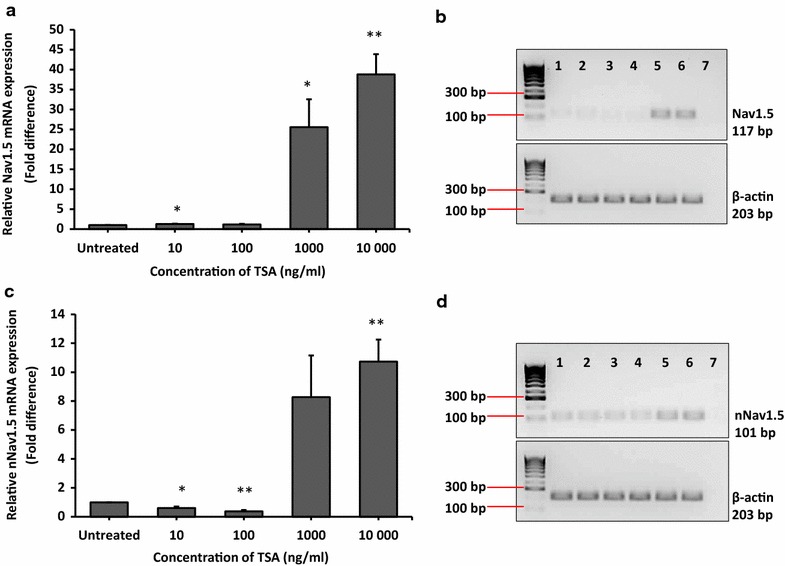
TSA increased the expression of Nav1.5 and nNav1.5 in MCF-7 cells. MCF-7 cells were treated with 10–10,000 ng/ml TSA for 24 h. Relative mRNA expression level was measured using qRT-PCR where β-actin was used as housekeeping gene. a Relative mRNA expression level of Nav1.5 normalised to untreated in MCF-7 cells after treatment. b Gel electrophoresis images of qRT-PCR products of Nav1.5. c Relative mRNA expression level of nNav1.5 normalised to untreated in MCF-7 after treatment. d Gel electrophoresis images of qRT-PCR products of Nav1.5. For gel images, lane 1 untreated, lane 2 control ethanol (qRT-PCR data not shown), lanes 3–6 10, 100, 1000 and 10,000 ng/ml TSA, lane 7 non-template control. Data were collected from n = 3 independent experiments, presented as mean ± SEM. Unpaired Student’s t test *p < 0.05 and **p < 0.01
