
Fig. 2.
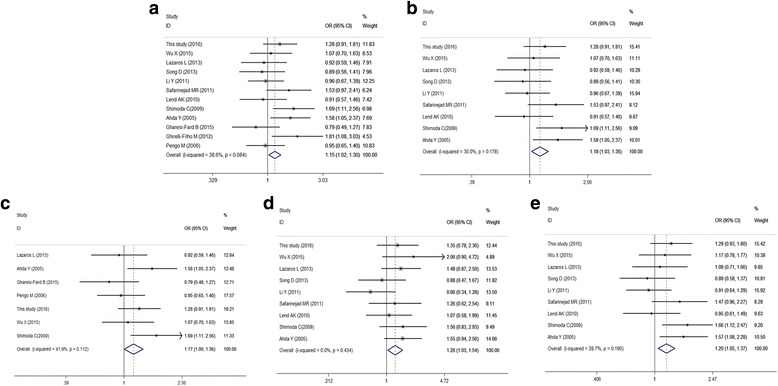
Forest plot for the association between FSHR rs6165 and male infertility for fixed effects model. a AG vs. AA in overall analysis; (b) AG vs. AA in subgroup analysis of HWE > 0.05; (c) AG vs. AA in subgroup analysis of case count > 200; (d) GG vs. AA in subgroup analysis of HWE > 0.05; (e) GG + AG vs. AA in subgroup analysis of HWE > 0.05. For each study, the point estimate of OR (the size of the square is proportional to the weight of each study) and 95% CI for OR (extending lines) is shown. Pool OR and 95%CI are presented as diamonds