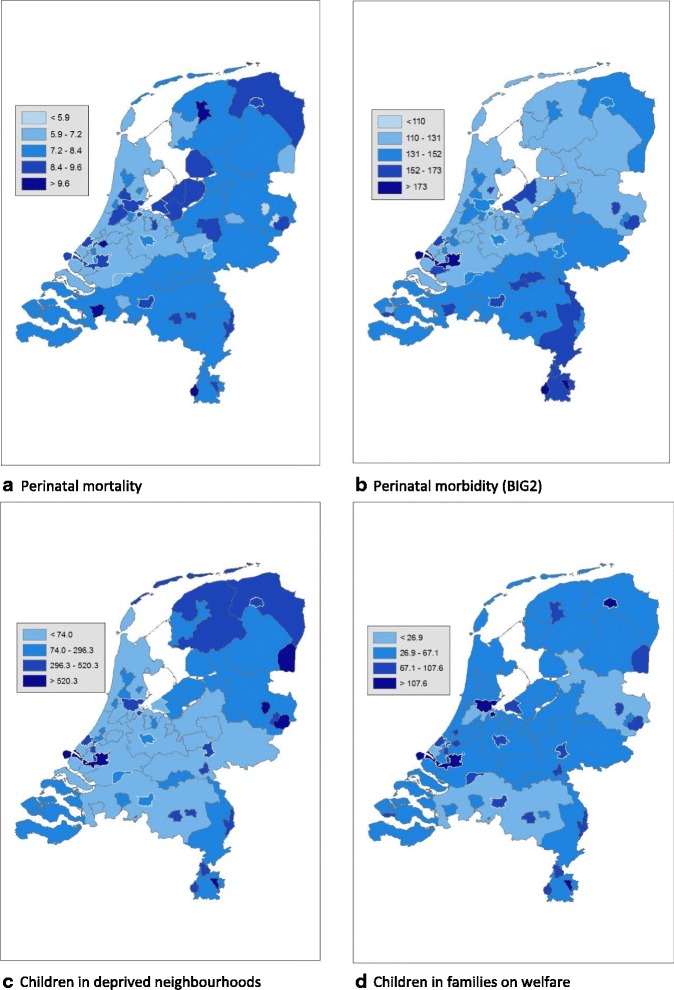
Fig. 1.

a-d. Prevalence per 1000 for 62 geographical areas in the Netherlands. The maps are based on data from Table 3, divided in five categories. The categories are formed based on the standard deviation (SD); the middle category being between −0.65 SD and 0.65 SD, the surrounding categories from plus and minus 0.65 to 1.96 SD and the outer categories below −1.96 SD and above 1.96 SD. In Fig. 1c and d the lowest category (values below −1.96 SD) does not exist due to skewedness of the data. The municipalities participating in HP4All-2 have a white border
